Built-in Dashboards
Fusion ships with built-in dashboards. To access these dashboards from the Fusion UI, click System > Log Viewer.
Fusion Logs dashboard
The Fusion Logs dashboard is the default dashboard (default.json). It lets you analyze logs from all of the Fusion services.
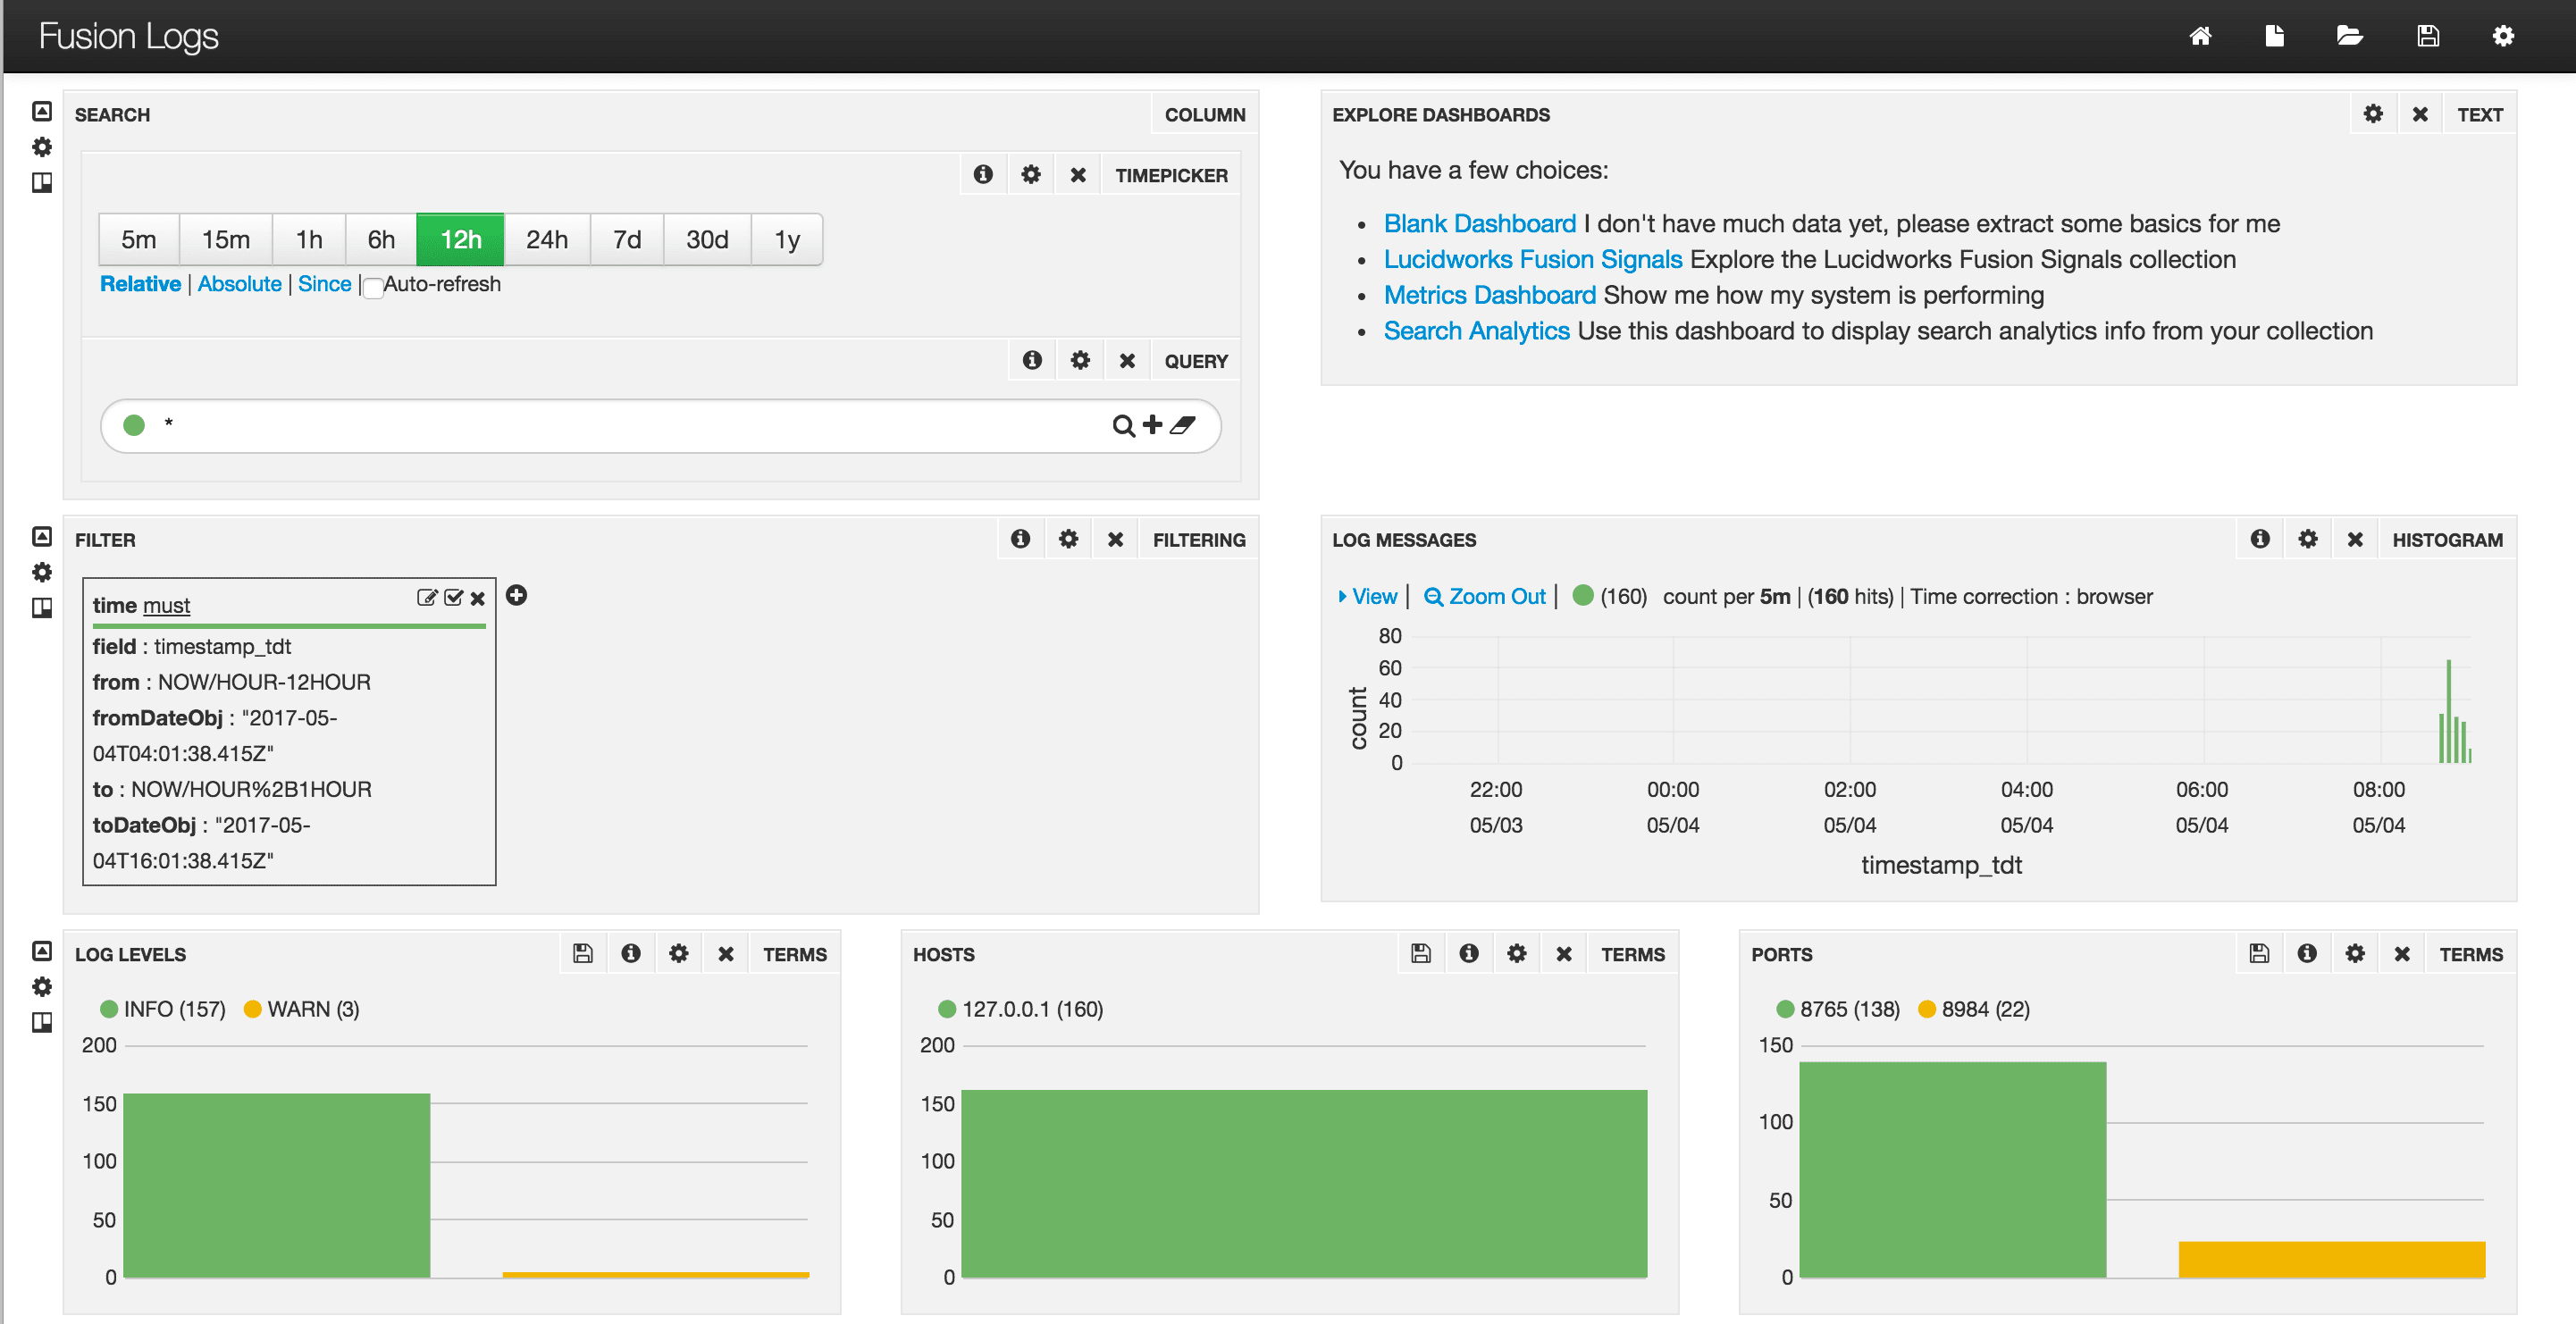
You can modify the default dashboard to suit your needs. To set a different dashboard as the browser default, click the dashboard you want to set as the default, then click Save > Set as Browser Default.
The Fusion Logs dashboard is similar to the Lucidworks Search Logs dashboard. Both access the logs collection. The content and layout differ slightly.
The Fusion Search Logs dashboard sends queries to Solr (/api/solr).
The Fusion Logs dashboard sends queries to a Fusion query pipeline (/api/query-pipelines/_system/collections/), and it specifies the global query parameter &df=message_t (use the field message_t as the default field).
To open the default dashboard from the Fusion workspace, click Analytics ![]() > Dashboards or System
> Dashboards or System ![]() > Log Viewer. Alternatively, on any dashboard, click Goto saved default
> Log Viewer. Alternatively, on any dashboard, click Goto saved default  .
.
Blank dashboard
An entirely blank dashboard (blank.json) is available. To open this dashboard from the default dashboard, click Blank Dashboard at the top right.
Fusion Metrics dashboard
The Fusion Metrics dashboard (lucidworks-metrics.json) displays key Fusion metrics from the Fusion collection system_metrics, if this type of metrics collection is enabled. See System Metrics.
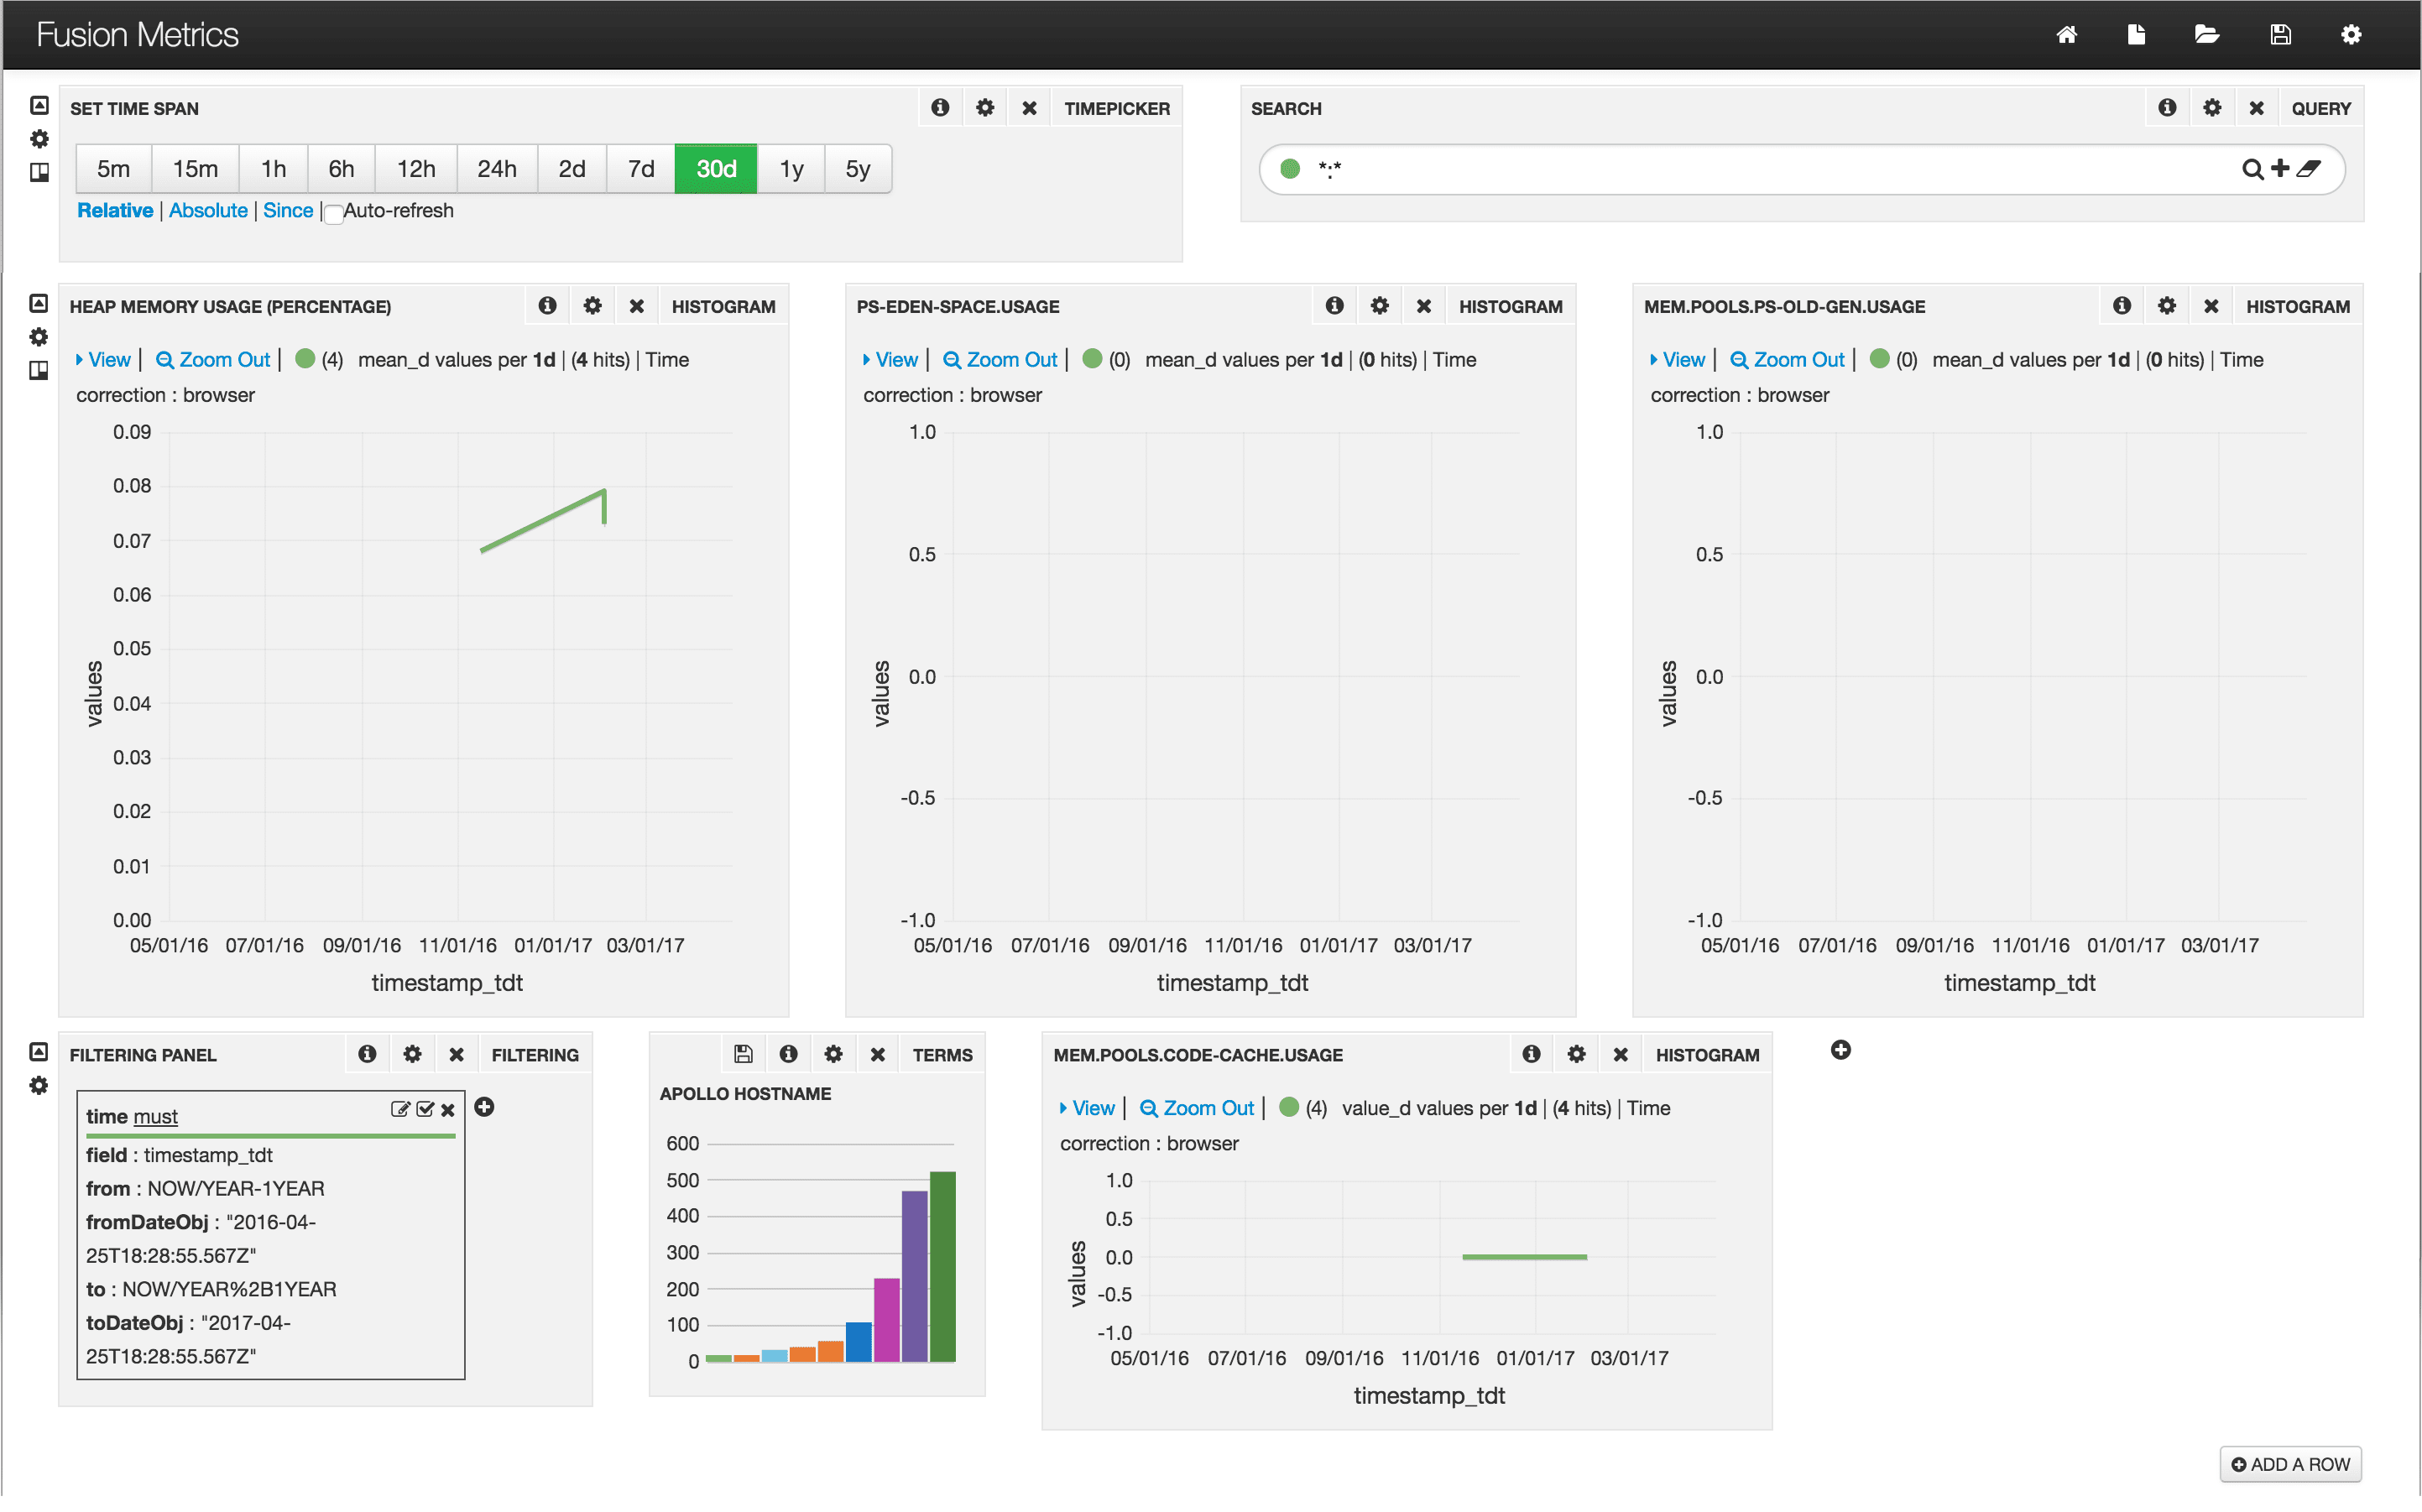
To open the Fusion Metrics dashboard from the default dashboard, click Metrics Dashboard at the top right.
Search Analytics dashboard
The Fusion Search Analytics dashboard (lucidworks-searchanalytics.json) displays search analytics derived from collection logs and from queries to Solr (/api/solr).
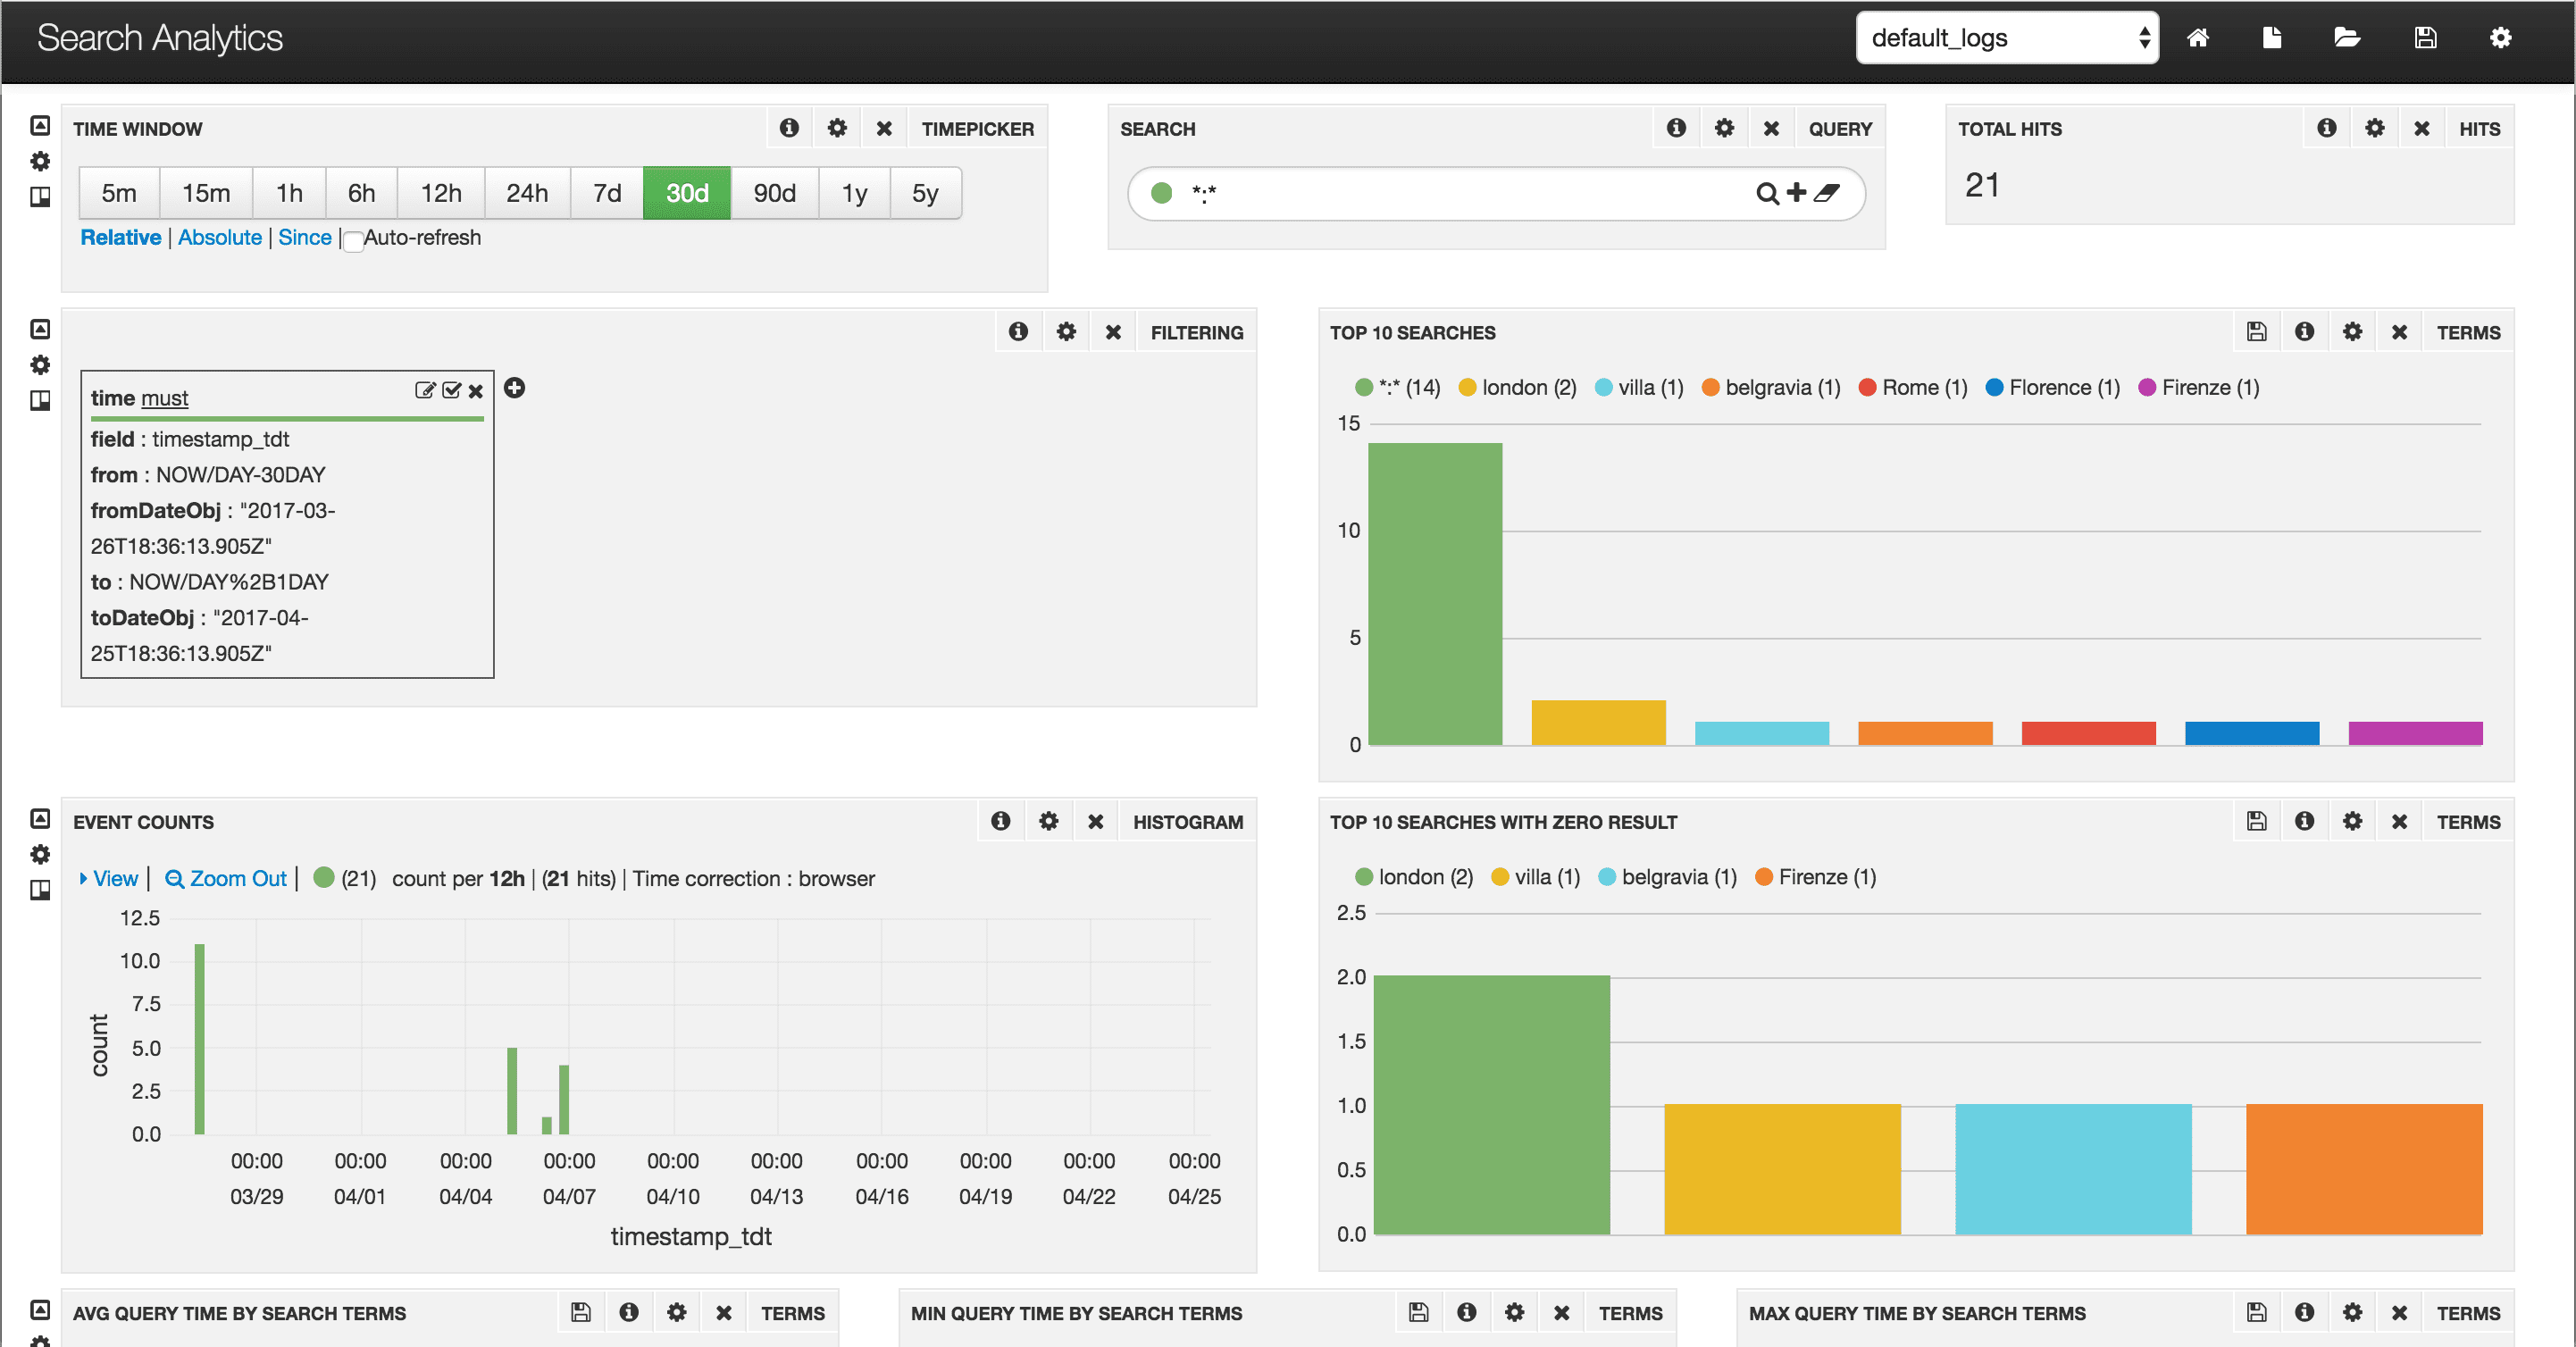
To open the Search Analytics dashboard from the default dashboard, click Search Analytics at the top right.
Fusion Signals dashboard
The Fusion Signals dashboard (lucidworks-signals.json) is a time-series dashboard that you can use to monitor signals collections. It uses the signal timestamp as the time field.
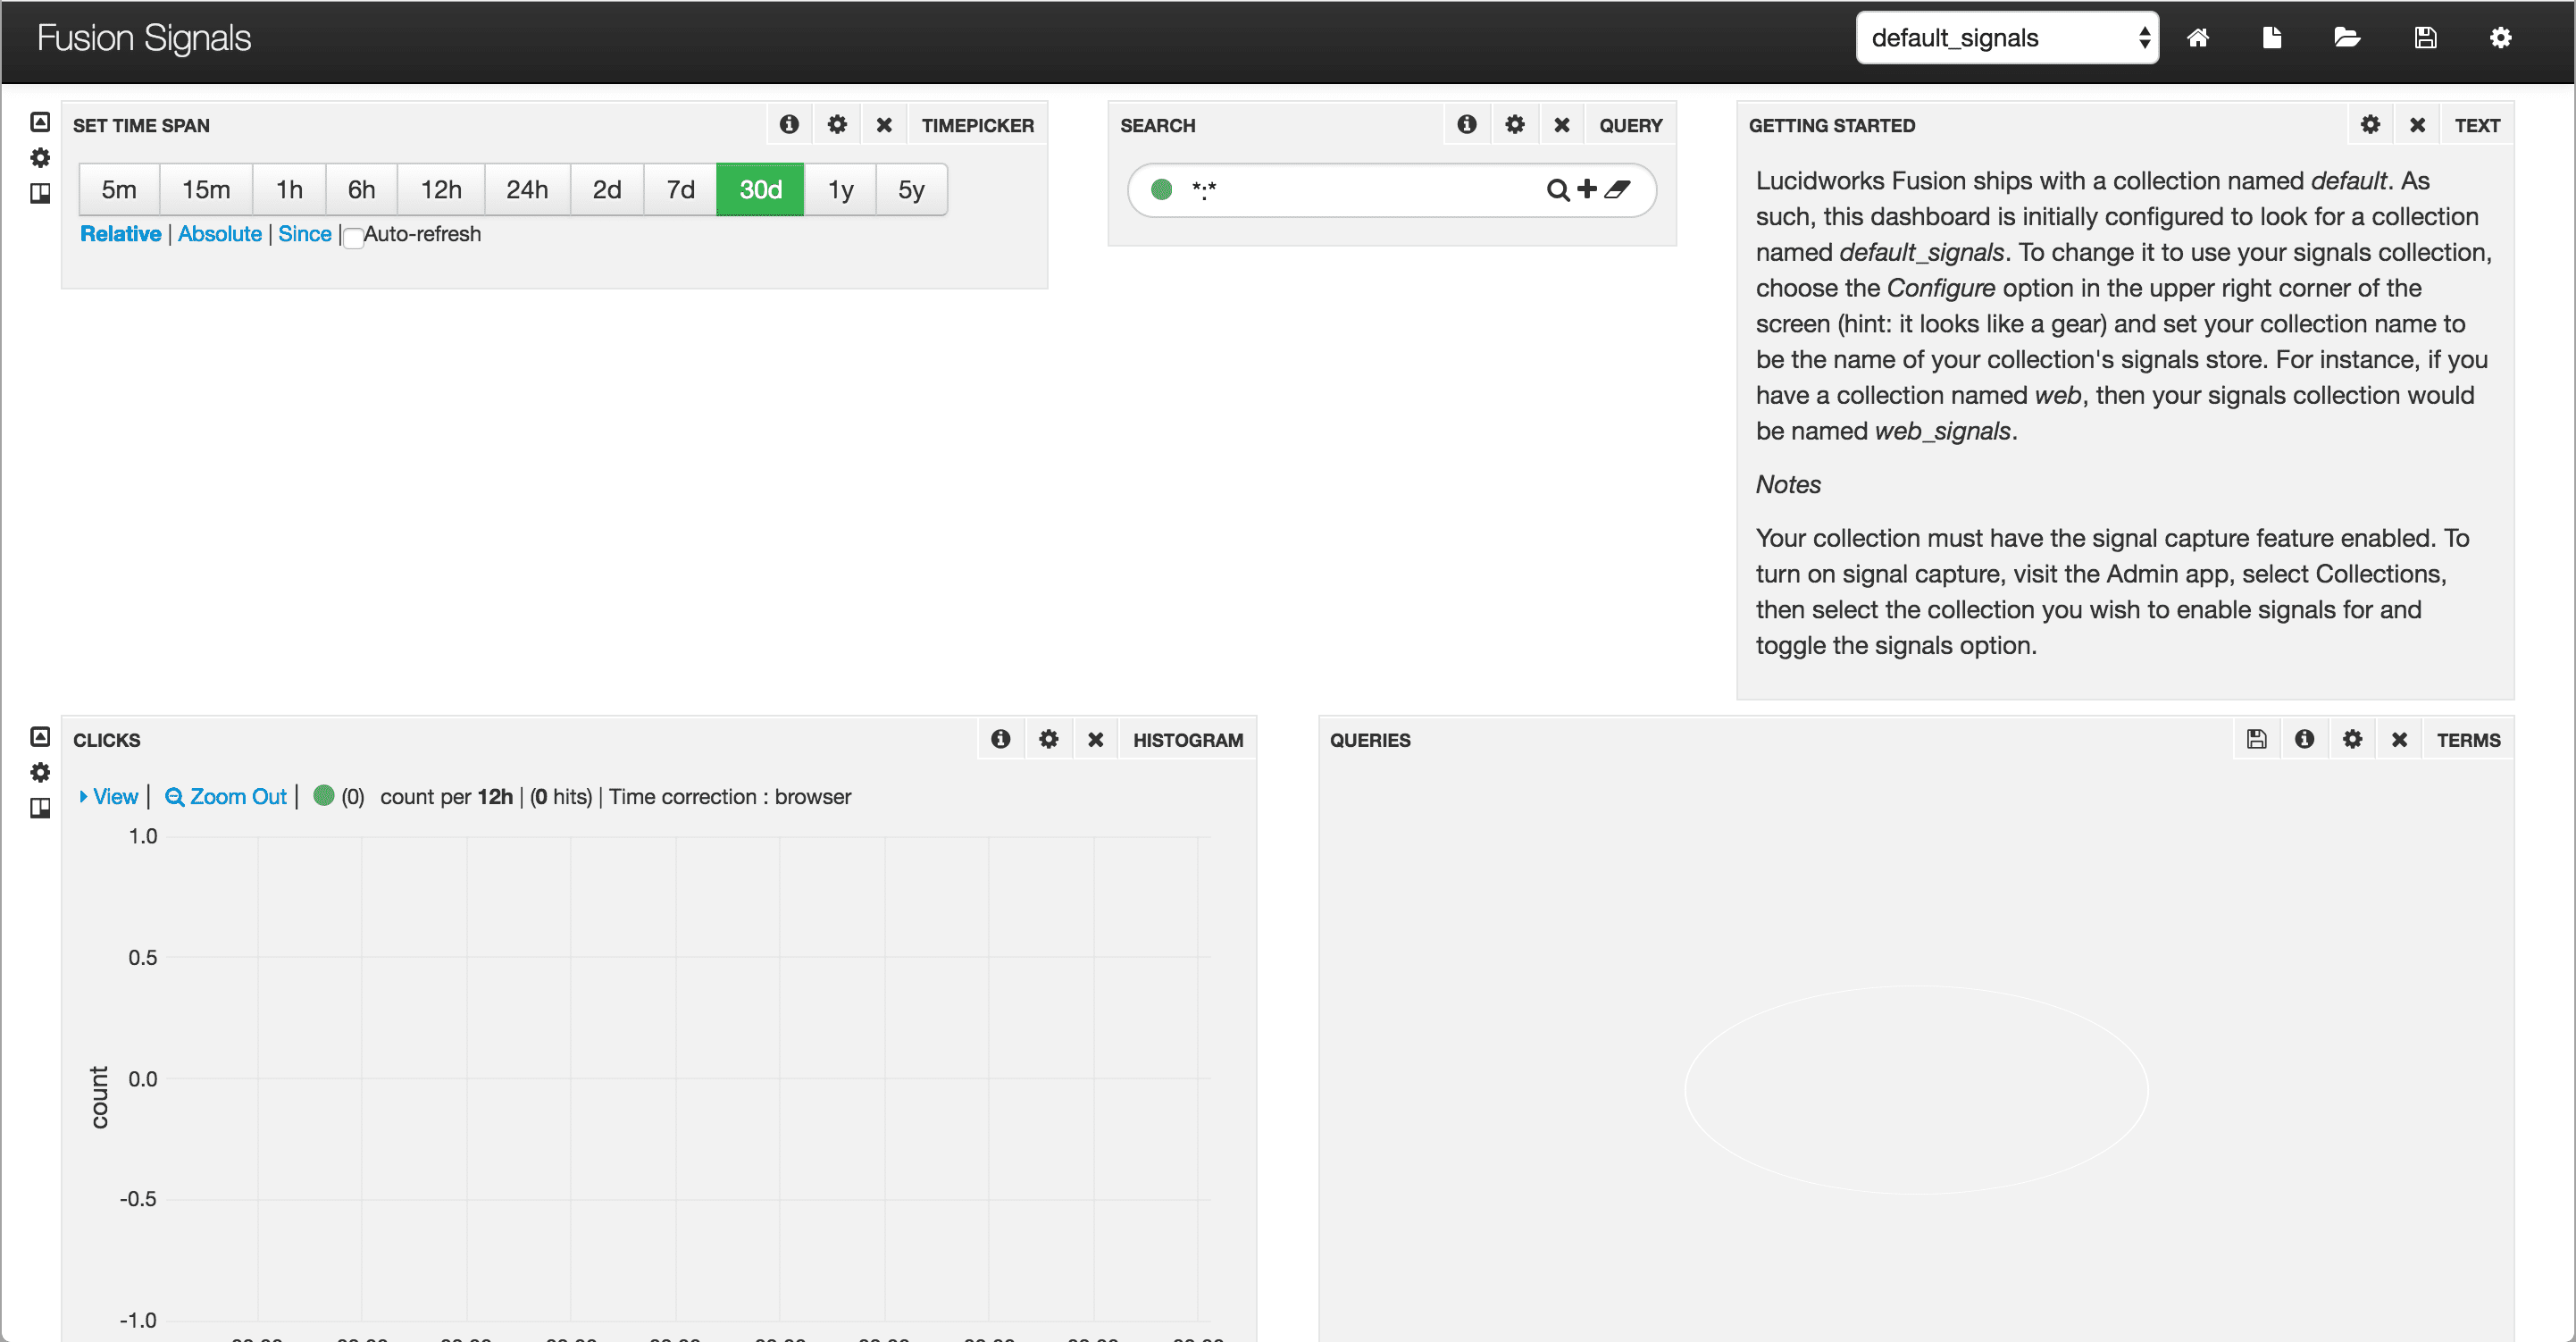
To open the Fusion Signals dashboard from the default dashboard, click Lucidworks Fusion Signals at the top right.
Default Non-Time-Series dashboard
Fusion includes a default non-time-series dashboard (default-nts.json). This is an example:
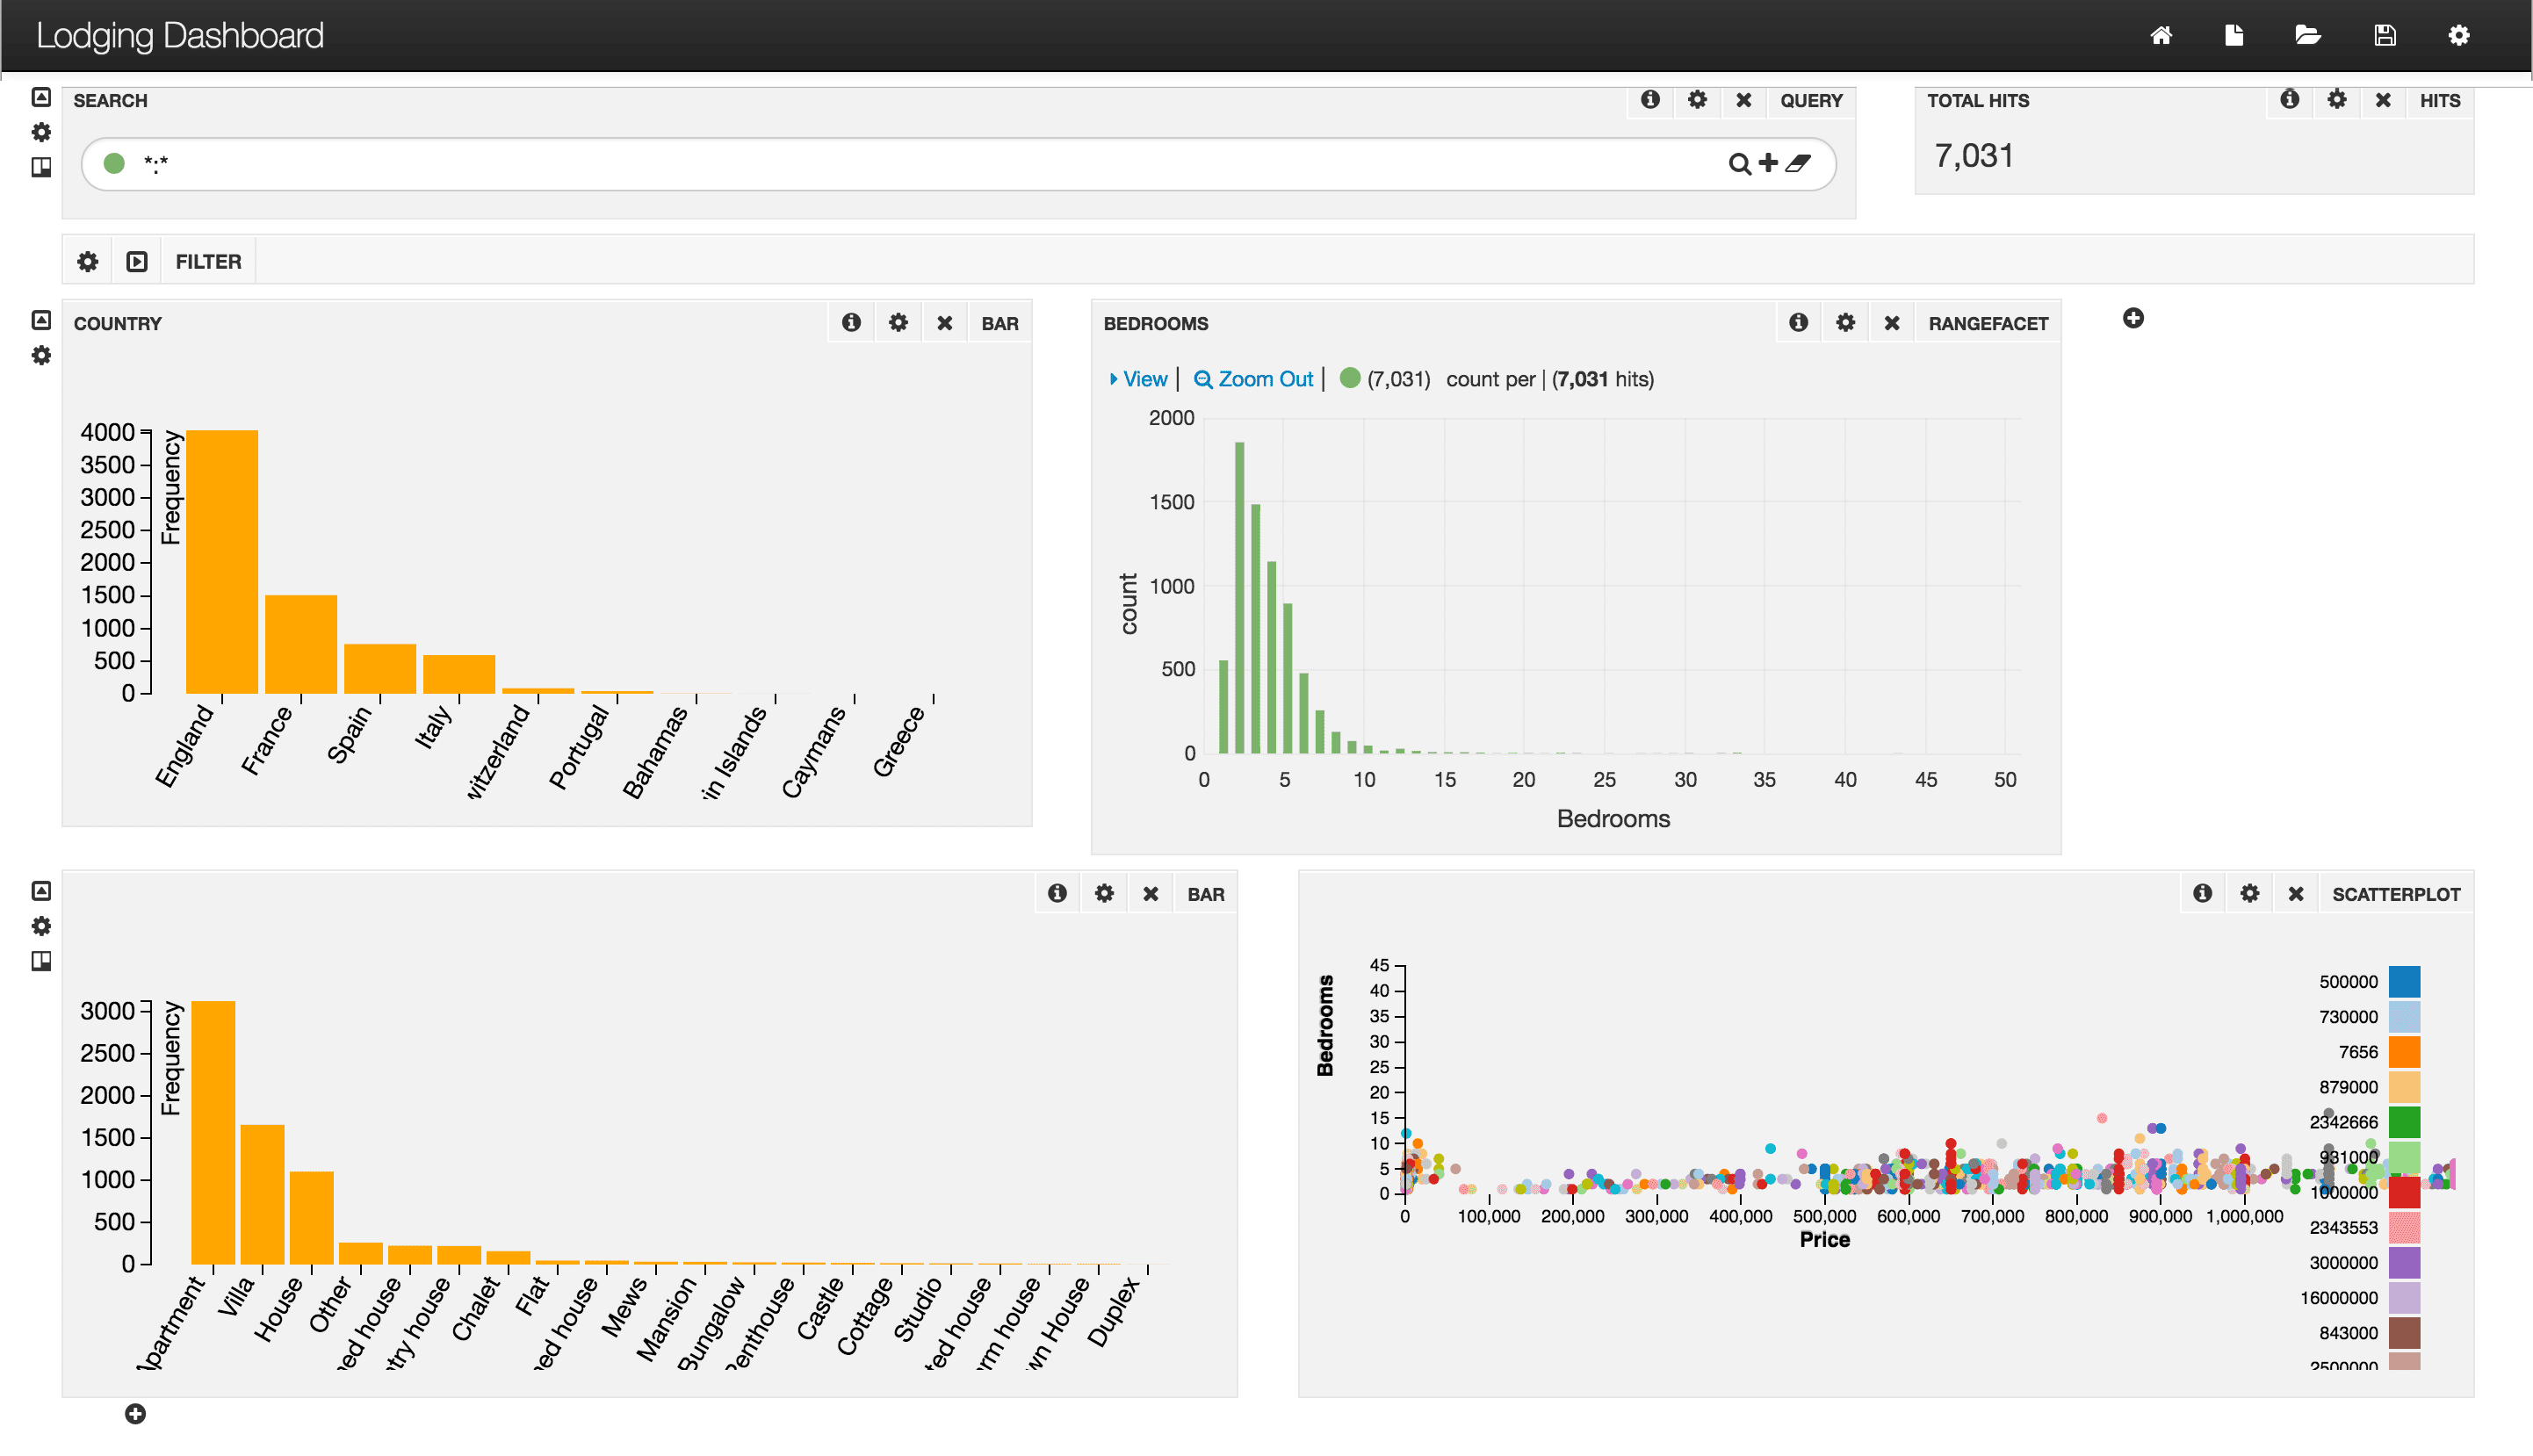
To open the default non-time-series dashboard, at the top right of any dashboard, click New > Non-time-series dashboard.
Default Time-Series dashboard
Fusion includes a default time-series dashboard (default-ts.json). This is an example:
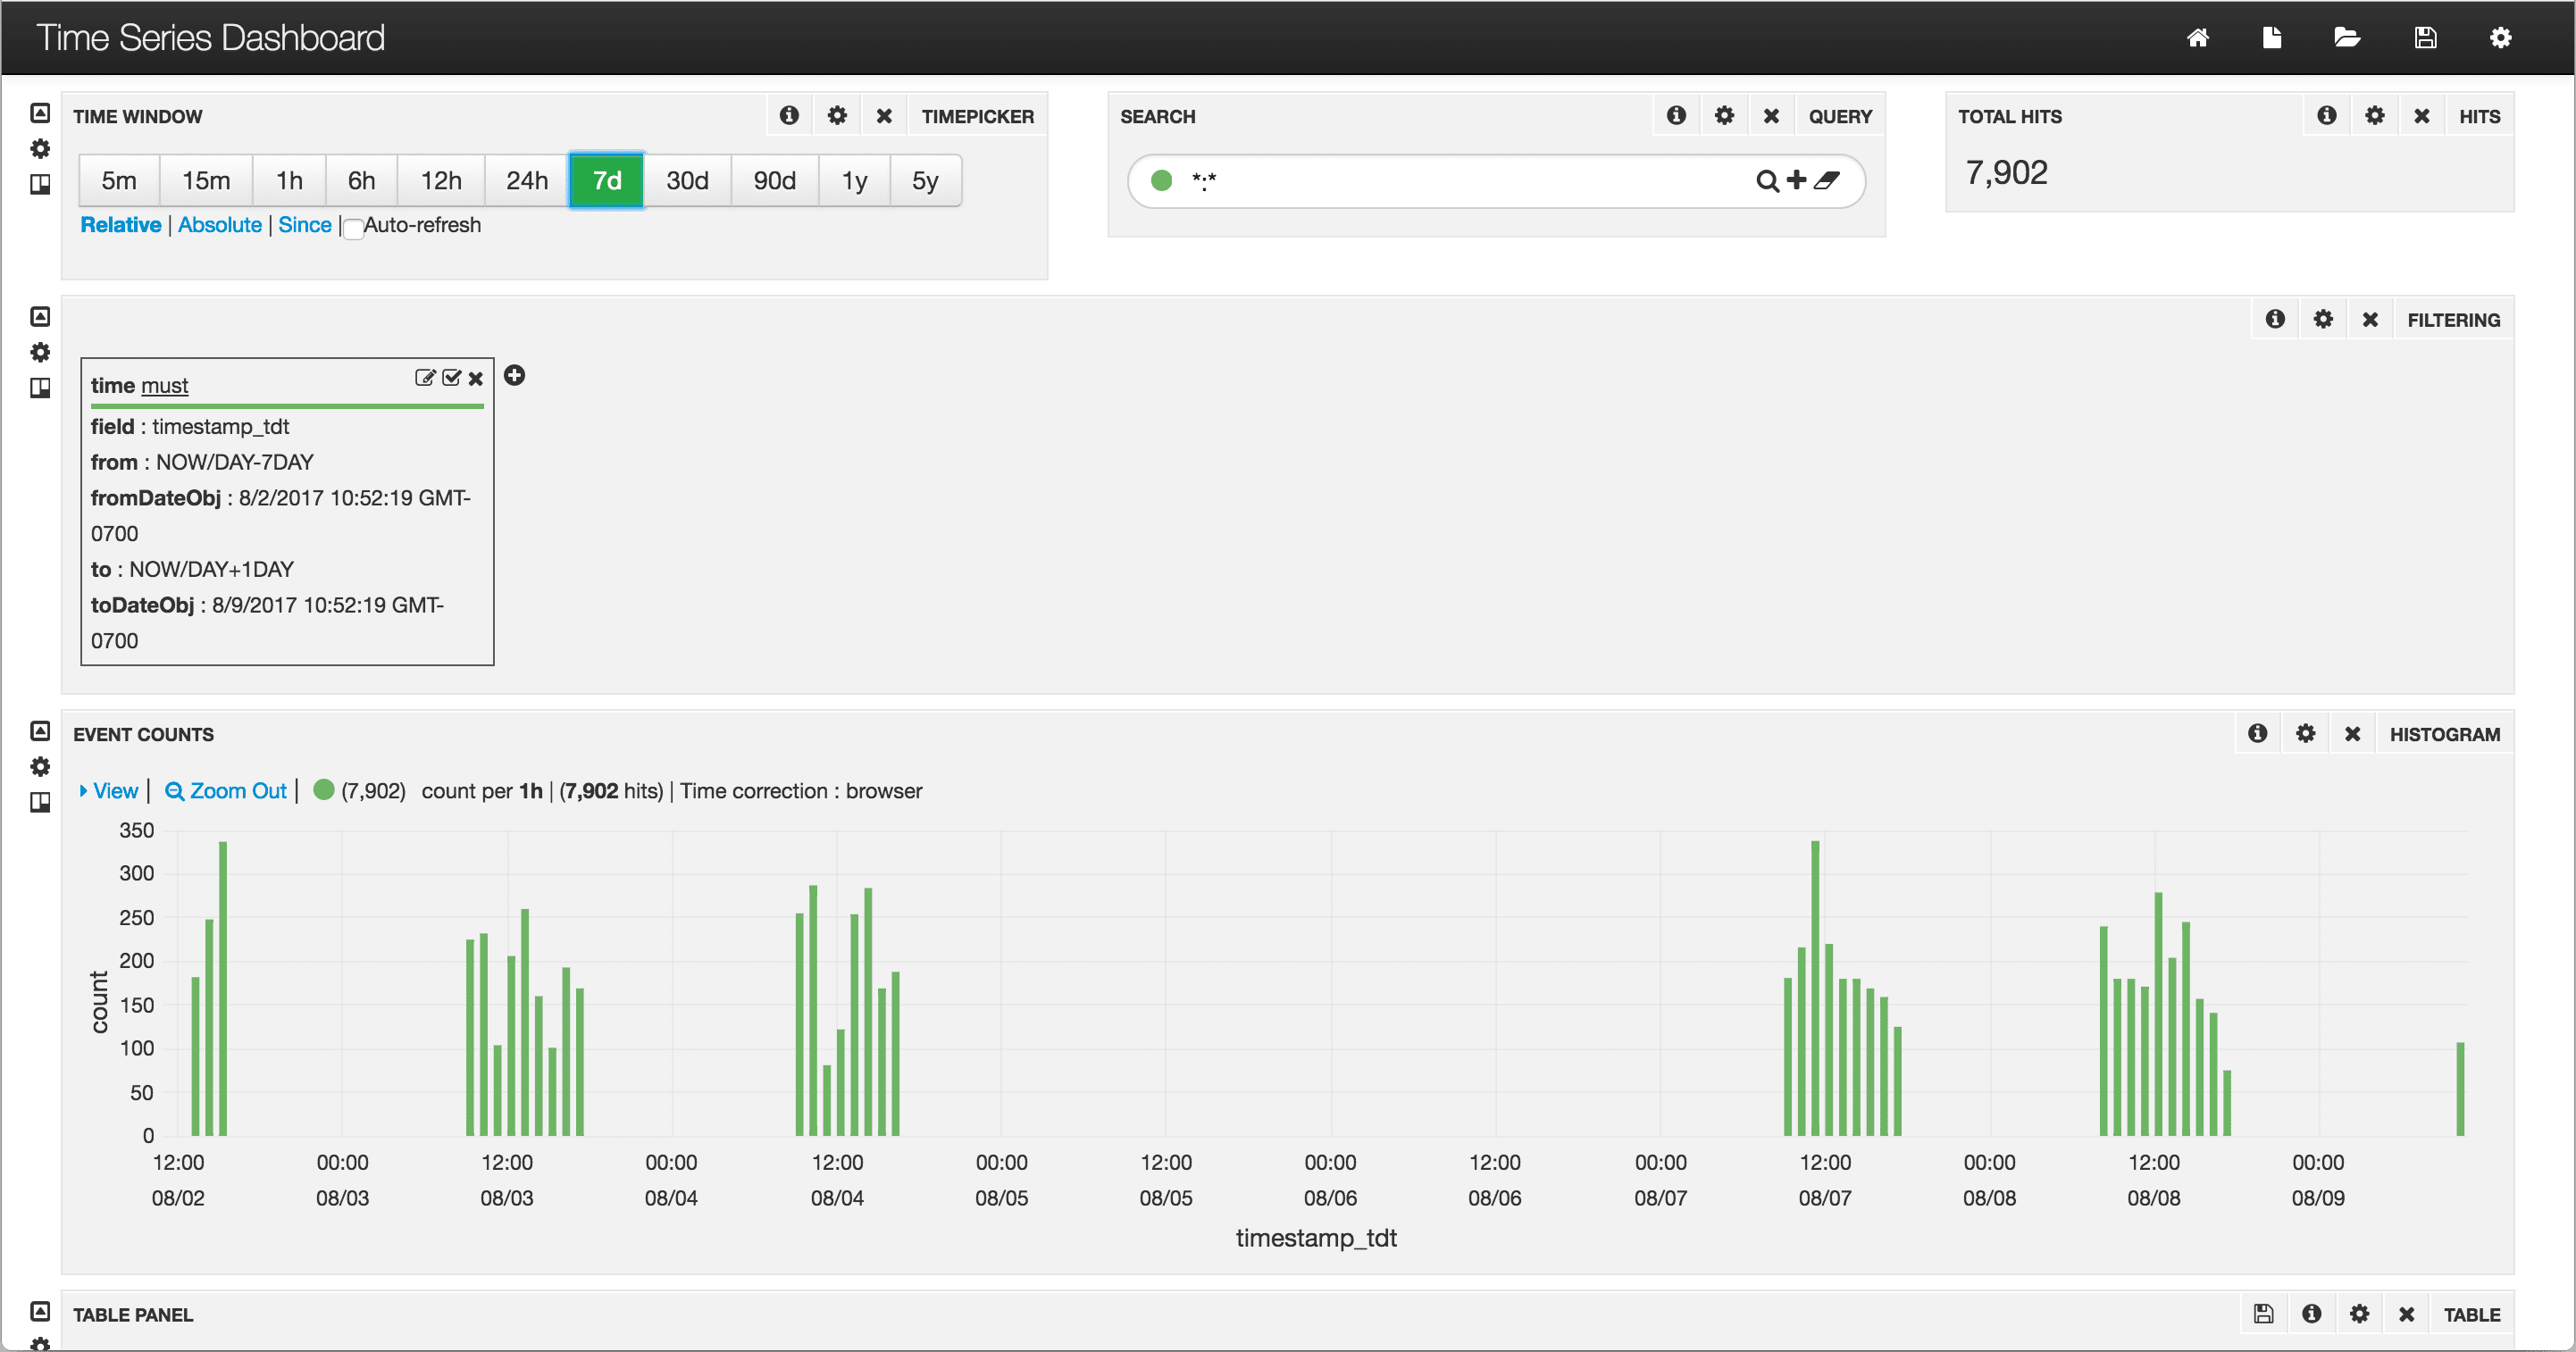
To open the default time-series dashboard, at the top right of any dashboard, click New > Time-series dashboard.