Percentiles (percentiles)
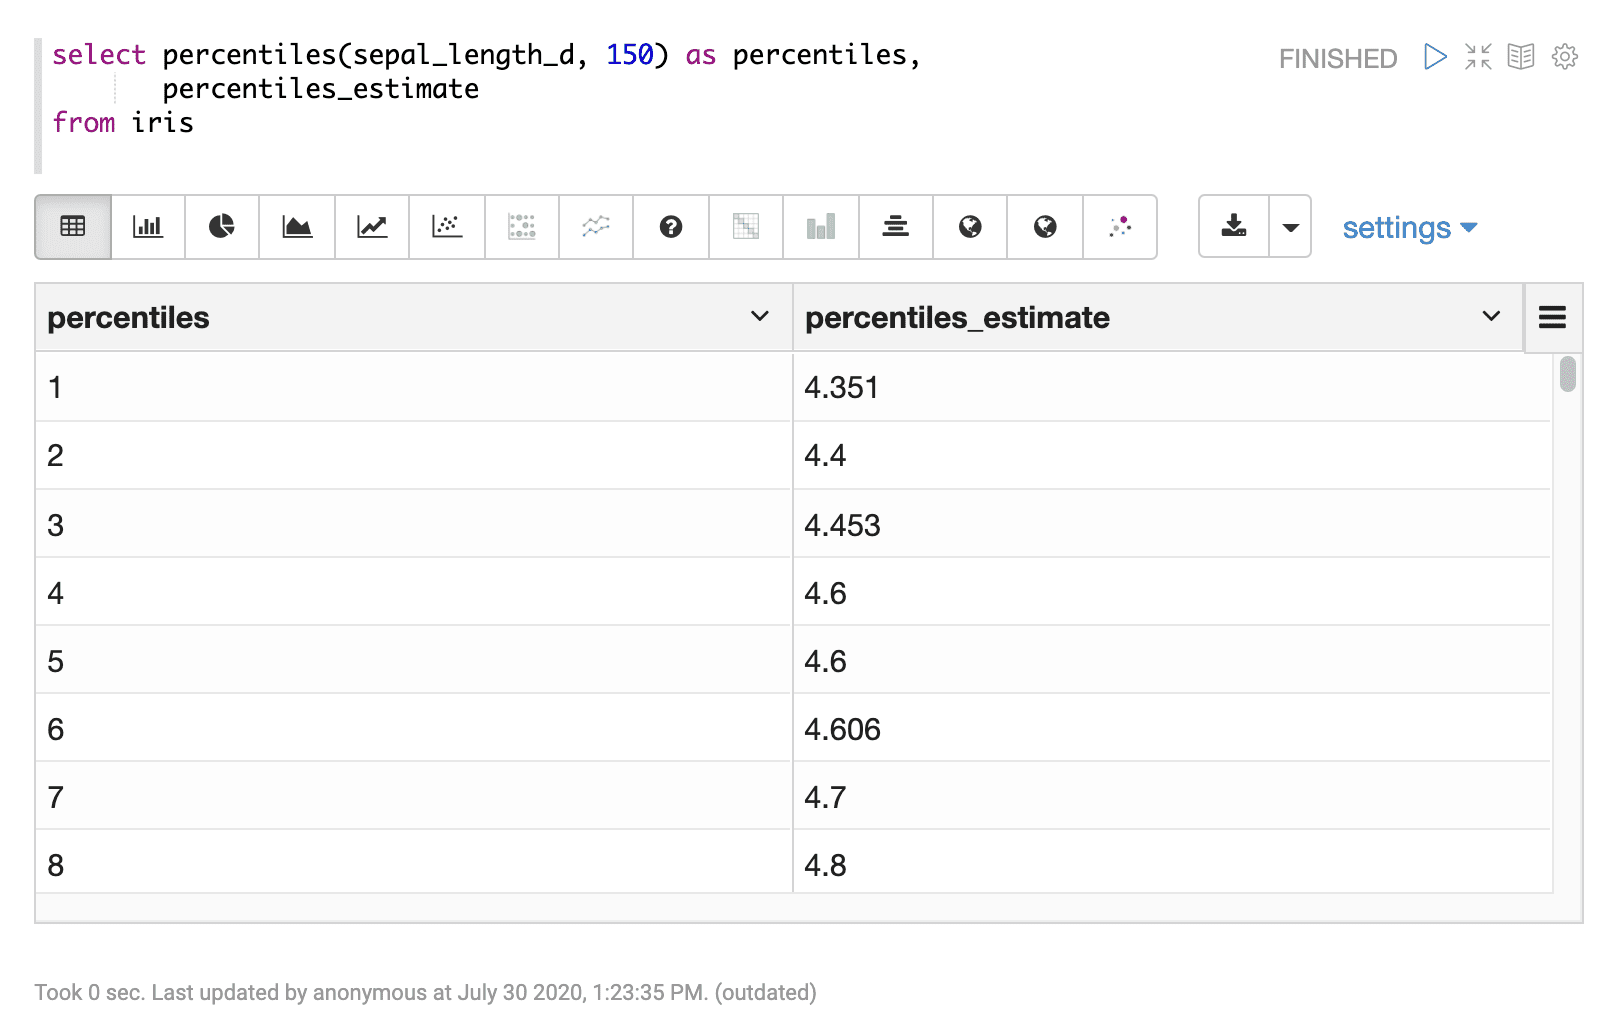
The percentiles function can be used to visualize the estimated percentiles (1-99) for a numeric field. The percentiles function takes two parameters:
-
The numeric field to compute the percentiles for
-
The sample size
Sample Syntax
select percentiles(sepal_length_d, 150) as percentiles,
       percentiles_estimate
from iris
Result set
The result set for the percentiles function contains one row for each percentile 1-99. The percentiles function returns the percentile (1-99). The percentiles_estimate field contains the estimated percentile value at each percentile.
The percentiles are calculated for a random sample that matches the WHERE clause. If there is no WHERE clause, the samples are taken from the entire data set.

Visualization
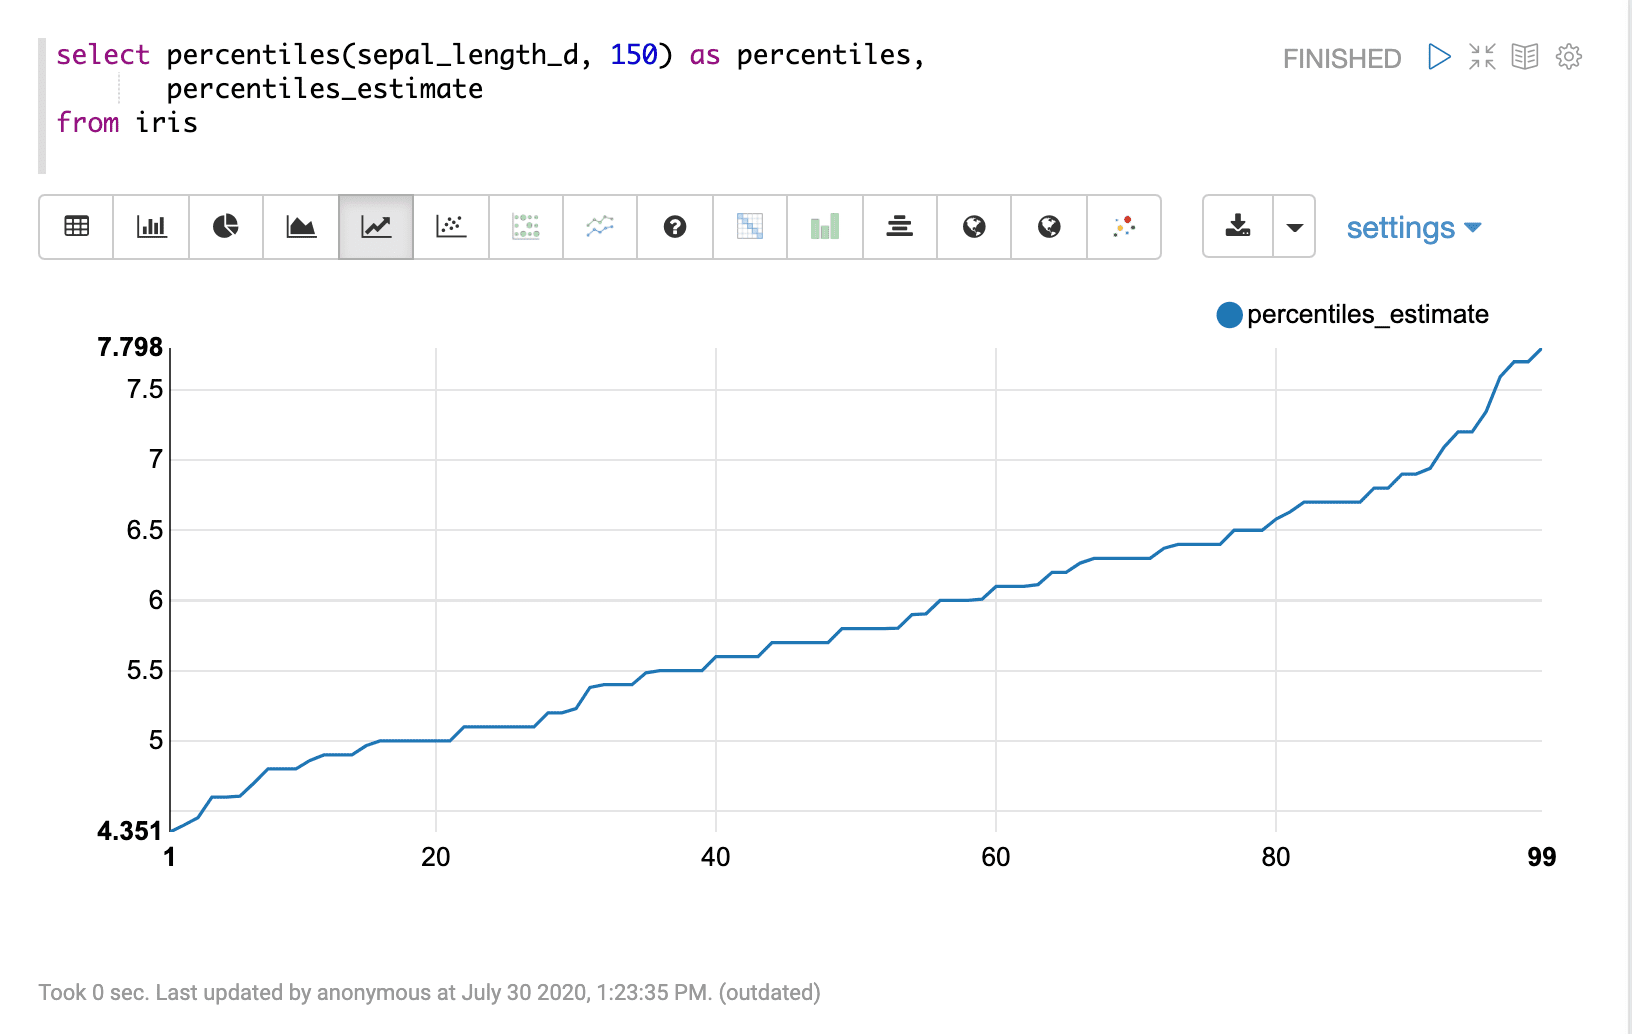
The percentiles can be visualized by plotting the percentile (1-99) on the x-axis and the percentile estimate on the y-axis.
Sample visualization of percentiles in Apache Zeppelin:
