The DevOps Center
| Fusion provides support for Prometheus and Grafana in Fusion for metrics collection and querying. |
However, the DevOps Center is a tool that provides some functions to monitor, troubleshoot, and investigate incidents. It consists of an interactive log viewer, providing views into this Fusion cluster’s hosts and services using metrics and events.
System requirements
The DevOps Center requires the following:
-
Your Web browser must support HTML5.
-
Every node that you want to monitor must be running Fusion version 5.x.x.
-
Every node that you want to monitor must be running the
agentandlog-shipperservices.
The DevOps Center is enabled by Fusion’s default configuration.
The Log Viewer
The Log Viewer displays service logs and request logs from Fusion’s system_logs collection.
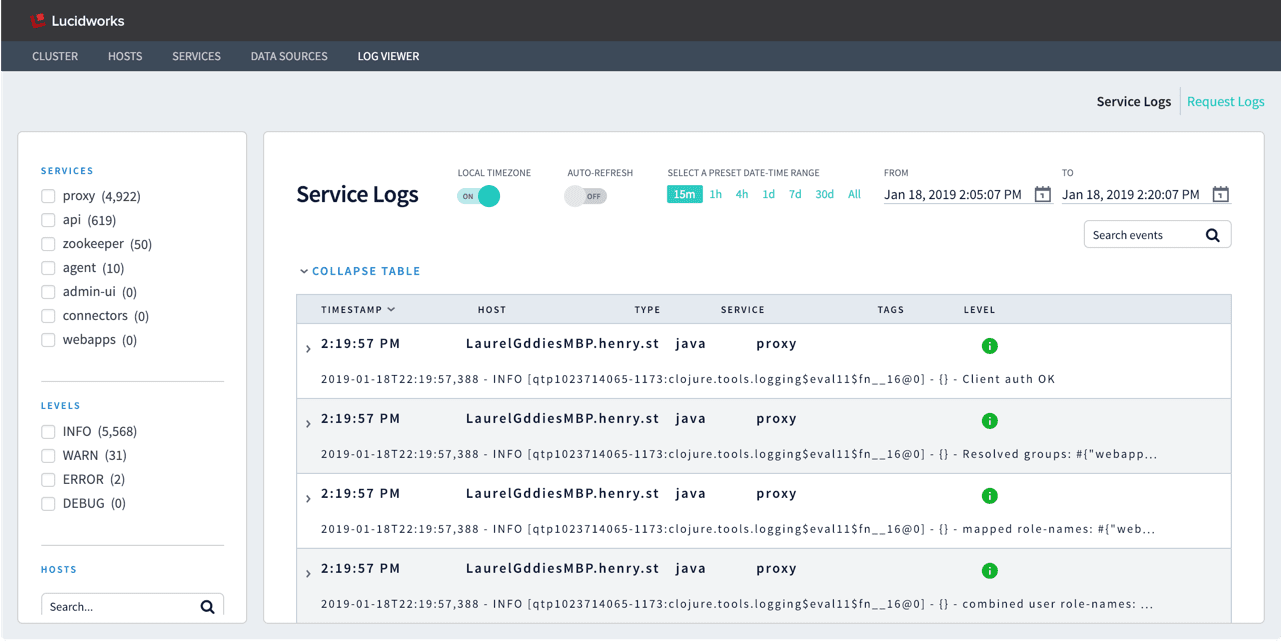
By default, timestamps are displayed in local time, as determined by your browser. To view timestamps in UTC (unless default.timezone is set to another time zone in fusion.cors), set LOCAL TIMEZONE to "Off".
Auto-Refesh is off by default, to display static log data. To display real-time logs, set this to "On".
See Export Data from the DevOps Center to learn how to export log data.
Service logs
Service log files are written to the filesystem by each running service, such as var/log/api/api.log, var/log/proxy/proxy.log, and so on. Fusion indexes them in the system_logs collection with type=java.
In the DevOps Center, you can filter service logs by:
-
Service
-
Log level
-
Host
Request logs
HTTP request log files are written to the filesystem by Jetty, at var/log/proxy/jetty_request_<date>.log. Fusion indexes them in the system_logs collection with type=http.
In the DevOps Center, you can filter request logs by:
-
HTTP status code
-
HTTP method
-
Host
Audit logs
Audit logs provide you with a resource for tracking actions within Fusion, including the date, time, user responsible, and more. Example use cases include determining:
-
When a query profile’s configuration changed to use
bqinstead ofboost -
Who created a datasource configuration and why they did so in a particular way
-
Whether a deployment is being tampered with
In the DevOps Center, you can filter audit logs by:
-
Status
-
Action
-
Verb
For example, you can examine the audit logs to learn who deleted a query pipeline by faceting by the approximate date range and selecting the Verb facet DELETE.
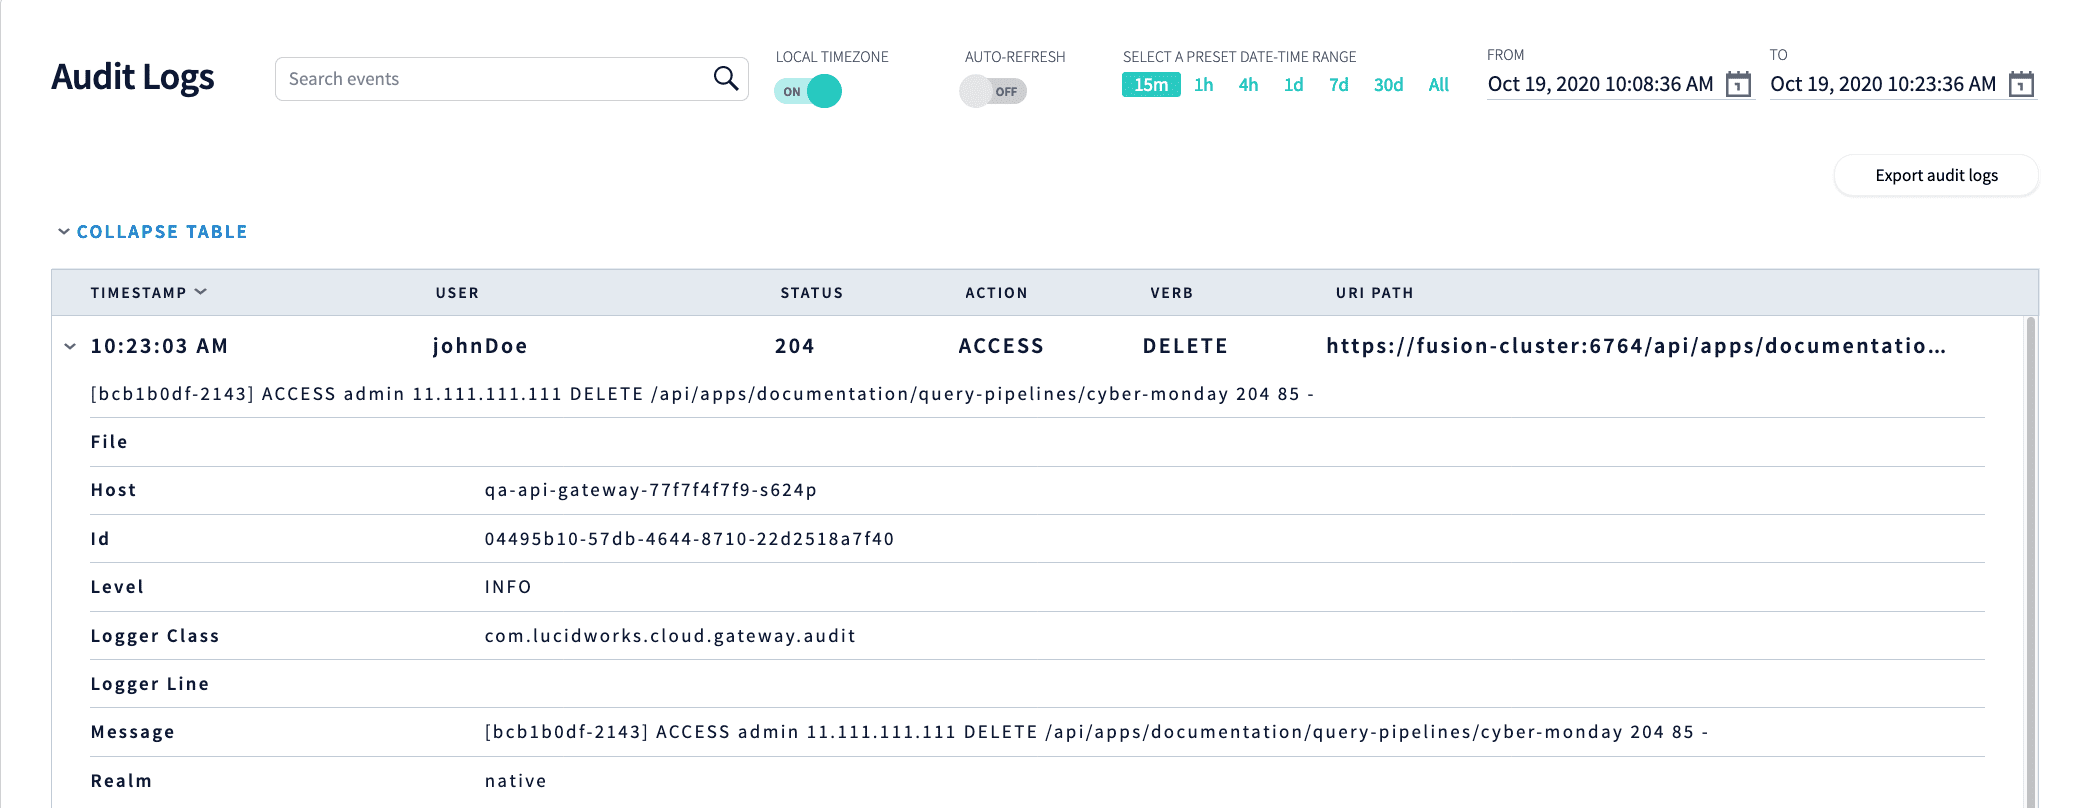
Click the Export audit logs for detailed log data, including:
| Field | Data |
|---|---|
mdc_action_s |
|
mdc_request_method_s |
|
mdc_request_uri_s |
|
mdc_user_agent_s |
|
mdc_username_s |
|
timestamp_tdt |
|