Install Grafana Dashboards
If you’re using Prometheus and Grafana to monitor the performance and health of Fusion services, Lucidworks provides pre-configured Grafana dashboards in the fusion-cloud-native repo.
Configure Grafana
If you used the install_prom.sh script to install Prometheus and Grafana into your Fusion namespace, retrieve the initial Grafana password from a Kubernetes secret.
-
Run the following:
kubectl get secret --namespace "${NAMESPACE}" ${RELEASE}-monitoring-grafana \
  -o jsonpath="{.data.admin-password}" | base64 --decode ; echo
Replace ${RELEASE}with your Helm release label, which is typically the same as your${NAMESPACE}value.To see the name of the Grafana deployment, run:
kubectl get deploy. -
With Grafana, you can either set up a temporary port-forward to a Grafana pod or expose Grafana on an external IP using a Kubernetes
LoadBalancer. To define aLoadBalancer, run:kubectl expose deployment ${RELEASE}-monitoring-grafana --type=LoadBalancer --name=grafana --port=3000 --target-port=3000 -
Use
kubectl get services --namespace <namespace>to verify that the load balancer is set up and has an external IP address. -
Navigate your browser to
http://<GrafanaIP>:3000. Log in with the usernameadmin@localhostand the password that was returned in the previous step. -
(optional) Create another administrative user with a more desirable password.
Configure the Prometheus datasource
If you used the install_prom.sh script, a default Prometheus datasource is pre-configured for you. If not, configure the Prometheus datasource in Grafana:
-
Click the gear icon on the left and navigate to Data Sources.
-
Click Add Data Source. Select Prometheus as the datasource type.
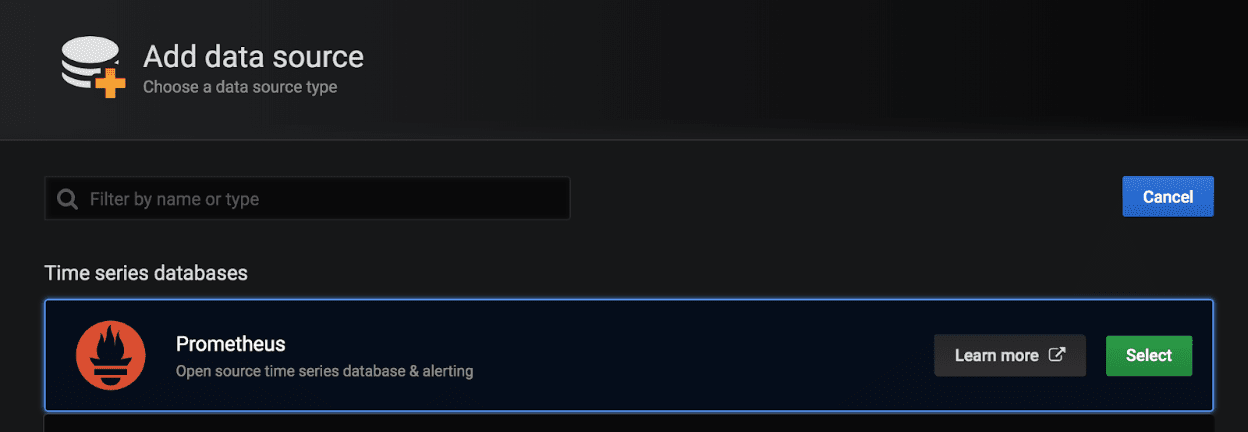
You are redirected to a page that asks for the address of the Prometheus server.
-
Enter
http://<RELEASE>-prom-prometheus-server -
(optional) Configure any additional fields, if desired.
-
Click Save and Test.
Import the Grafana dashboards
If you used the install_prom.sh script, then Fusion’s default Grafana dashboards will already be imported. If not, import the dashboards from the fusion-cloud-native repo.
-
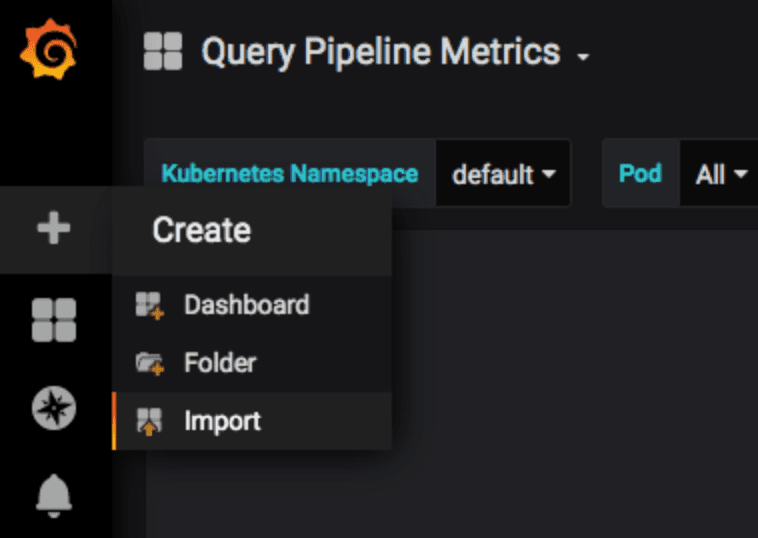
Click the gear icon on the left and select Import.
-
Import the Grafana dashboard JSON.
-
Click the Load button.