Use the Analytics Screen in the Rules Editor
This article describes how to use the Analytics screen in the Rules Editor.
| The Analytics screen was renamed from the Dashboard screen in Fusion 5.2.0. All functionality remained the same. |
UI elements
Data date range
-
Quick Range Selectors. Click one of the quick range selectors to facet your data.

-
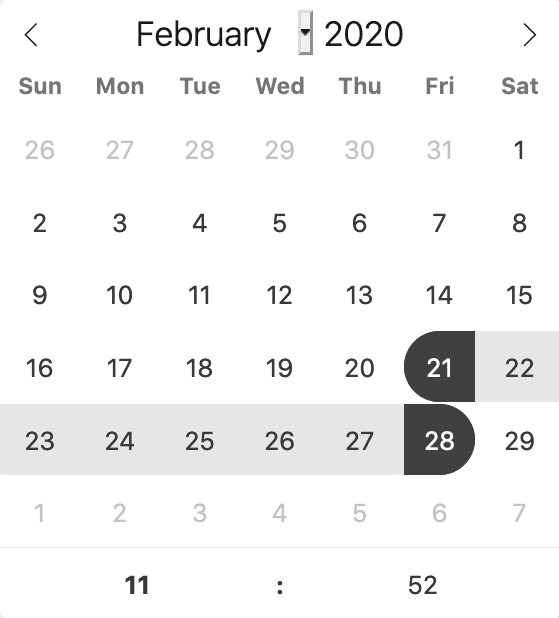
Calendar Selector. Use the calendar selector to specify a start and end date and time facet for your data.
Visitor data
-
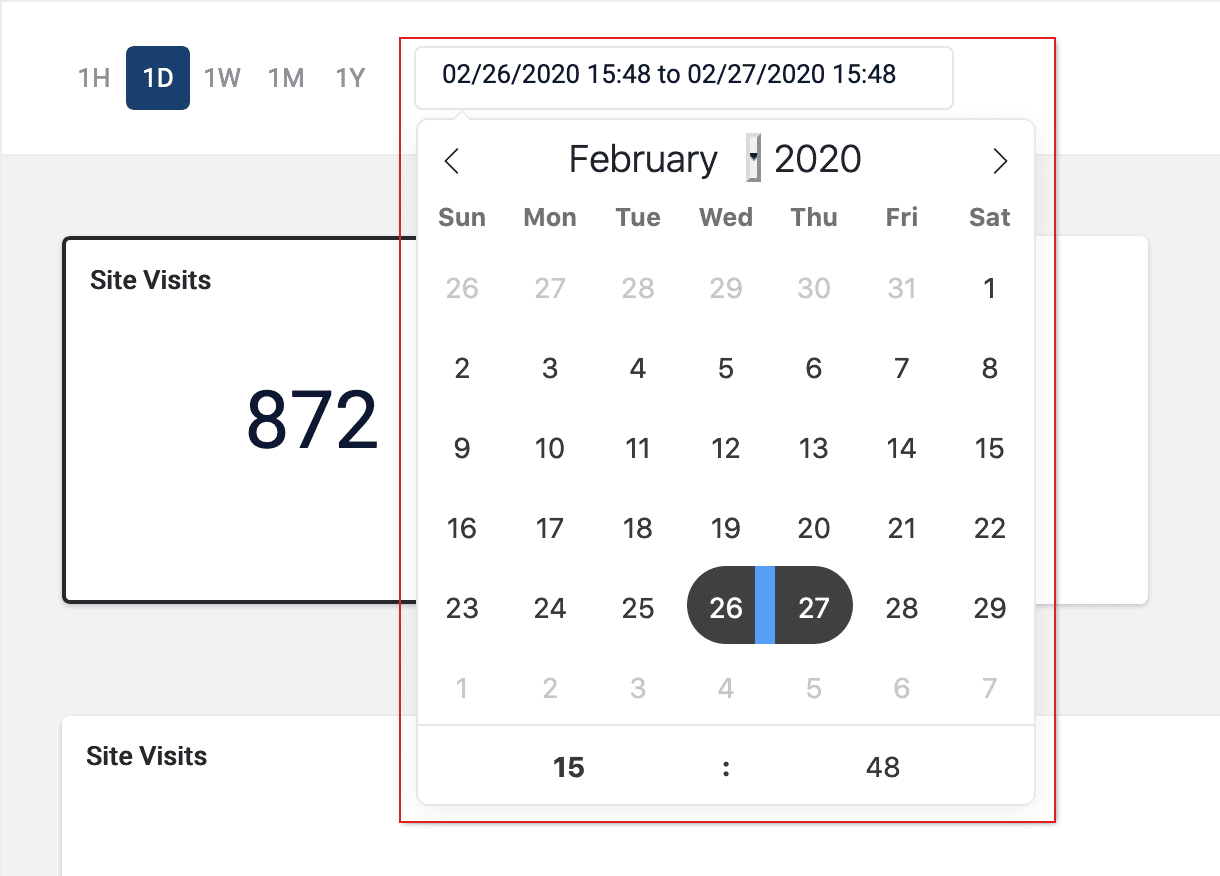
Data Cards

-
Site Visits. The total number of visits.
-
Total Searches. The total number of searches performed.
-
Unique Visitors. The number of unique visitors to your site.
-
Average Session. The average length of time spent on your site.
-
-
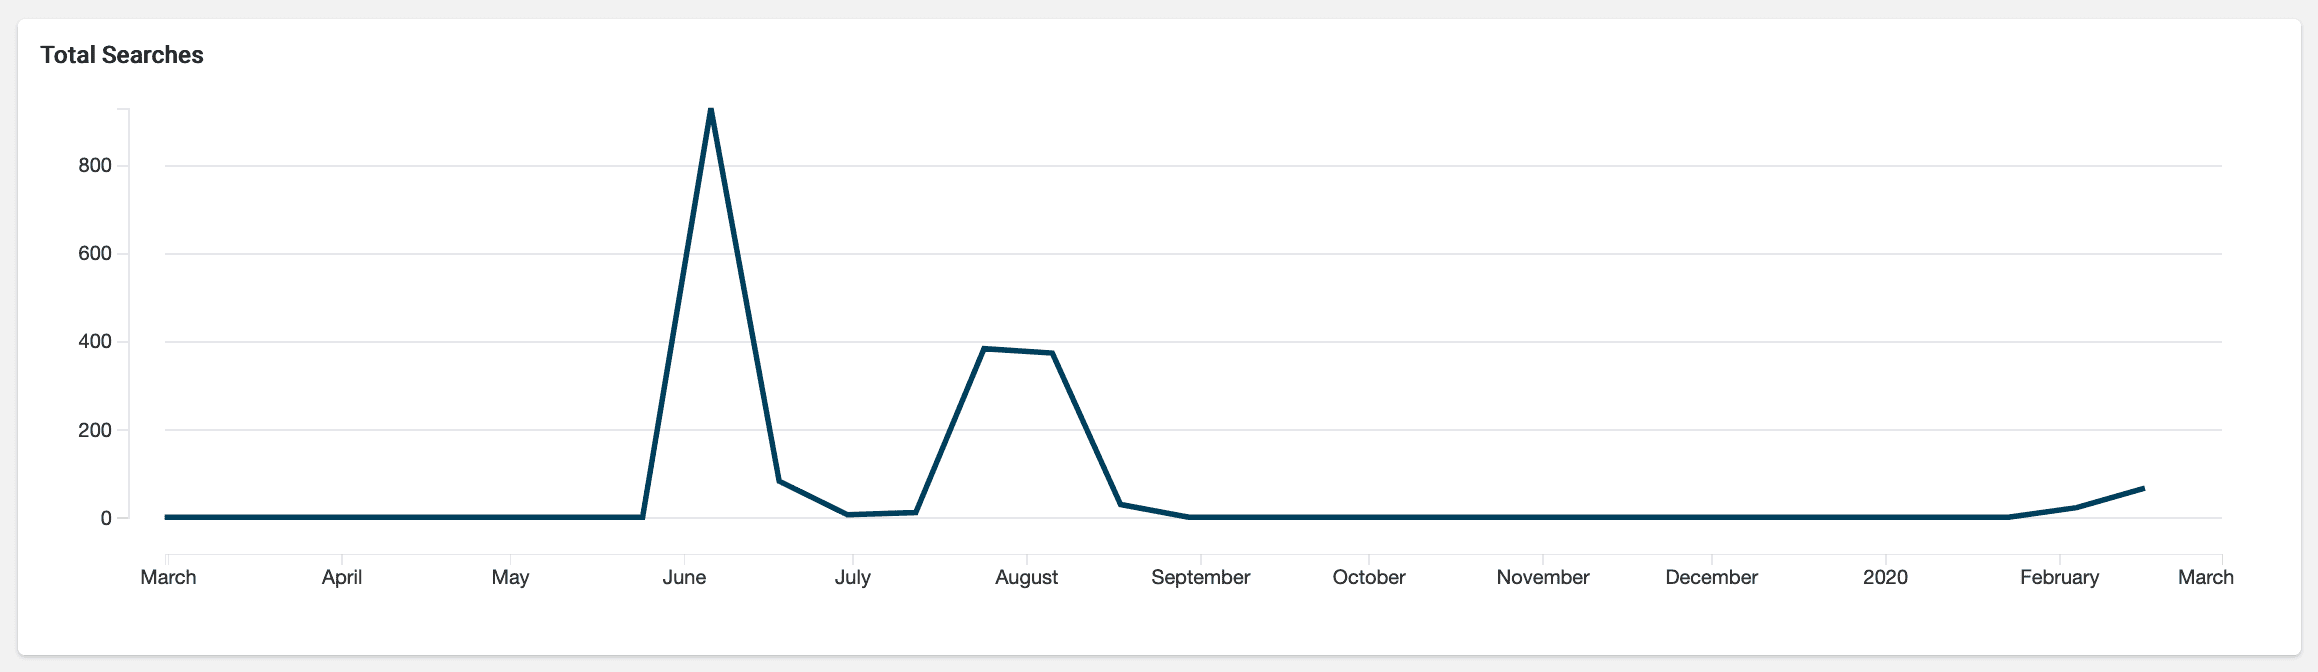
Data Graph. Detailed information for the selected data card.
View data by date range
The Rules Editor analytics allows you to view data by a date range. To do this, you can either:
-
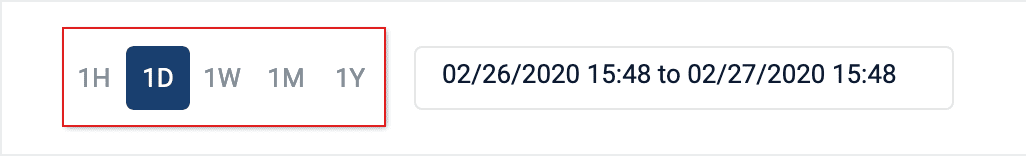
Click one of the date range presets:
-
Click the date range details to display and select your range on the calendar that appears:
View additional card details
Click one of the analytics cards to view additional details for that card’s data.